Matthew Kenwood, a PhD student at UT Health San Antonio, is a neuroscientist and bioinformatician who has been using Trailmaker™ to analyze his single cell RNA sequencing datasets generated from his innovative stroke model. Here, he walks through some of the discoveries he’s made using the Trailmaker tool to analyze multiple datasets that were generated using both Parse Biosciences and 10x Genomics™ technologies. Using Trailmaker has enabled him to standardize data processing and improve quality control when working with multiple technologies. Beyond improving his data analysis workflow, Matthew sees Trailmaker as a tool that lowers the barrier to rigorous data analysis, encourages deeper exploration beyond traditional methods, and enables collaboration by making results more accessible to his team.
Can you tell me about the single cell RNA-sequencing projects you’ve been working on?
I’m the bioinformatician for several single cell projects from my own lab (PI Mark Goldberg MD) and a collaborator’s lab (PI Ann Stowe PhD). As a result, I’m involved in the analysis of multiple datasets generated using both Parse Biosciences’ combinatorial barcoding and 10x Genomics droplet-based approaches. Overall, the goal of these projects is to define the gene expression changes in a wide array of central nervous system cell populations in response to stroke. Since cell death is inevitable after stroke, we’re particularly interested in understanding the mechanisms of recovery and repair across multiple brain regions.
As a bioinformatician, how has Trailmaker fitted into your data analysis workflow?
For Parse datasets, I upload the FASTQ files to Trailmaker and run the FASTQ processing pipeline and downstream filtering and integration within the platform. Then, I download the processed Seurat object and do the advanced analysis in R using my existing workflow.
For our 10x Genomics data and publicity available datasets from GEO, it’s really easy to upload the count matrices to Trailmaker. What this allows me to do is have a consistent starting point for all datasets regardless of barcoding technique. This is important because it’s often difficult to understand from published papers what data processing steps were applied and what QC checks were made. The data quality can vary wildly. Trailmaker has been vital in enabling me to apply a consistent and central pipeline, in order to perform the analysis with confidence, and even to quickly exclude very poor quality datasets without wasting any time on them.
Can you provide some examples of the Trailmaker features that you’ve found particularly valuable and why?
I love the QC plots! It’s really helpful to quickly and easily see the quality of my individual samples across different metrics, like the total number of genes, mitochondrial content and doublet score.
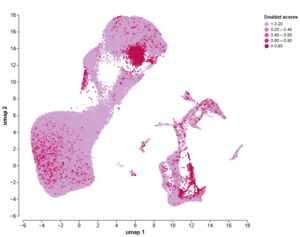
The doublet score plots proved critical when I was recently troubleshooting a collaborator’s dataset that was generated using 10x Genomics ChromiumTM technology. I was baffled that Cell Ranger output is not filtered well, so I uploaded the raw unfiltered matrices to Trailmaker for more reliable interactive QC check and filtering. I could immediately see that the doublet rate was much higher than expected, and inclusion of those cells in the analysis was causing misinterpretation of the data. In Trailmaker, I could quickly filter out the population of doublets, and I was then able to continue with the downstream analysis, confident that the dataset was cleaned up properly.
Before doublet exclusion
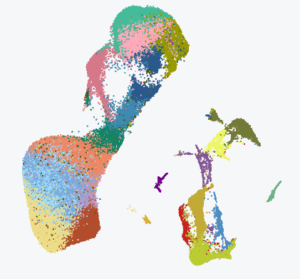
After doublet exclusion
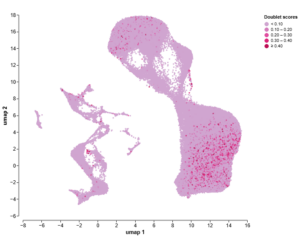

Figure 1: Exclusion of doublets from my 10X Genomics Chromium dataset using Trailmaker led to cleaner downstream analysis, meaning I could trust the findings. The UMAPs are coloured by doublet score (top) and Leiden clustering (bottom), both before (left) and after (right) exclusion of doublets.
The data sharing and visual elements of Trailmaker also meant that I could explain to my collaborators what the issue was and how I had resolved it. Furthermore, Trailmaker enables other members of the lab, who are also experts in the subject, to provide additional guidance to the analysis, instead of it being entirely guided by me. Data analysis is often biased to the interests of the individual conducting the bioinformatics work and incorporating more experts with different opinions greatly benefits the analysis and strengthens the resulting conclusions
Can you share more about why you decided to use Parse technology for your current project?
The majority of the single cell RNA-sequencing studies performed to date in stroke models typically investigate the first 48 hours after stroke. At this time the tissues are dealing with acute injury, hypoxia, and inflammation. It’s beyond that (e.g., days 3-21) when we would expect to see changes in gene expression that will lead to structural changes, such as axon sprouting, synapse formation, etc., that are indicative of recovery. Therefore, the goal of our current project is to investigate gene expression changes at 3, 7 and 21 days after stroke.
We chose to work with a Parse Biosciences Evercode WT kit as it allowed us to run all 16 independent samples in a single kit at the same time. In doing so, we are avoiding any potential batch effects, which will make the data easier to integrate and ensure we can detect even small differences in gene expression in our populations and brain regions of interest. Plus we get to perform the hands-on part of running the kit ourselves which is an added bonus!
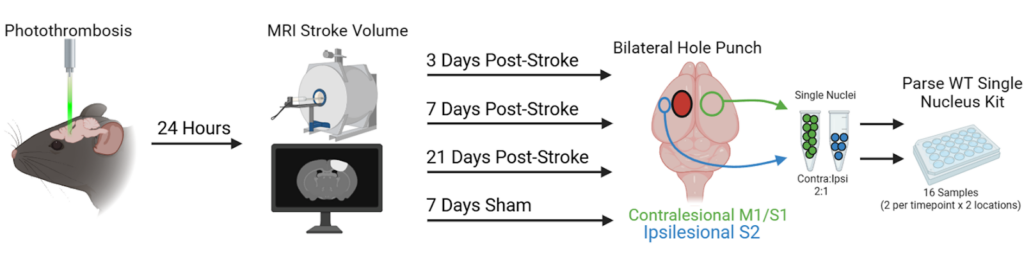
Figure 2: Experimental set-up for running our Evercode WT kit with 16 independent samples.
After a stroke in one side of the brain, the other side can take over the control of the whole body in a phenomenon called spontaneous plasticity, which can help restore motor function. This effect is particularly apparent in mice and in children, but doesn’t function so well in adults. We’re interested in studying this phenomenon by comparing the gene expression changes initiated in the region of tissue around the stroke lesion, the peri-infarct cortex (ipsilesional), and in the contralesional cortex (contralesional). Our goal is to identify genes and pathways that regulate plasticity and repair after stroke, which may be targeted in future studies.
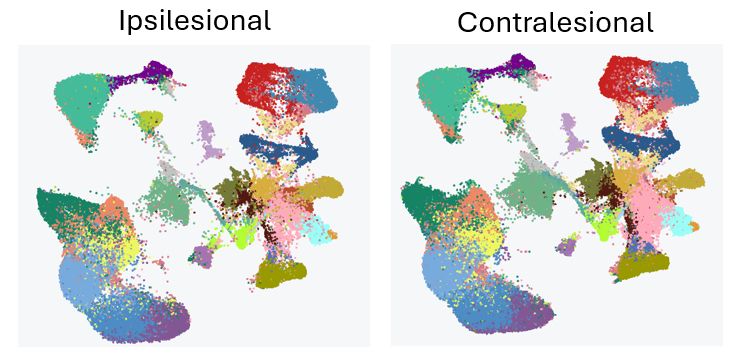
Figure 3: Initial analysis of our Parse Biosciences Evercode WT kit showing UMAP plots for our two brain regions of interest.
What do you think are the biggest challenges single cell technology users are facing with regard to data analysis?
It’s a lot of data! As barcoding methodologies and sequencing costs continue to decrease and datasets grow exponentially larger, as illustrated by the Parse Mega Kit, more and more labs are tapping into single cell sequencing for both hypothesis testing and hypothesis generation across fields. As the experiments become more monetarily feasible for academic scientists, the major hurdle for a lot of people is the lack of training or expertise to analyze these datasets reliably and repeatedly. Furthermore, the majority of scientists and institutions still lack the computational resources that can handle an increasingly large number of cells and read depth.
For example, the Seurat object from our Parse dataset is already ~14GB to start with. I’m lucky that I have access to a computing cluster with lots of available RAM in order to handle and analyze this dataset. But not every researcher has that luxury. What Trailmaker does for the community, I believe, is to significantly lower the bar of entry for data analysis while maintaining the integrity of rigorous data analysis. Furthermore, I think a tool such as Trailmaker will inspire scientists and trainees to become better educated due to their curiosity about their data in analyses beyond the traditional differential expression and clustering, such as pseudotime trajectories, making interpretation and evaluation of others’ data significantly more rigorous.
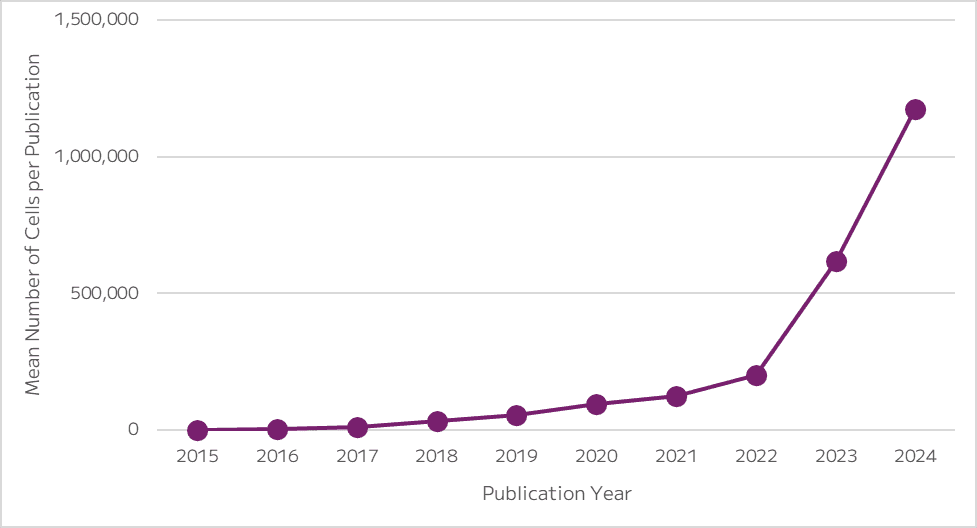
Figure 4: Plot shows the mean number of cells per publication over time, indicating that single cell studies are getting bigger.
Meet Matthew
Matthew is a PhD student at UT Health San Antonio in Mark Goldberg’s Lab. Matthew’s primary research focus is in the field of stroke recovery where he takes a multiomic approach to investigate neural repair after stroke. He is actively working on numerous large scale transcriptomics and connectomics studies throughout the entire central nervous system, where he functions both as the bioinformatician and experimenter handling the surgical duties.
“Working with Parse and Trailmaker has been pretty amazing! More data than we could have asked for actually.”
Read the full story
Matthew is currently preparing multiple manuscripts for publication, including the single cell RNA-seq datasets mentioned above. When the pre-prints are available, the links will be provided here.

