Technology

Discover scalable, instrument-free single cell sequencing technology from Parse Bioscience

Technology Overview


Resources

Explore our collection of resources to learn more about technology and its applications from leading researchers

Resources Overview

Company

Providing researchers single cell sequencing with unprecedented scale and ease

About Parse

BLOG › Best Practices › Getting Started with scRNA-seq: Library Preparation, QC and Sequencing

Getting Started with scRNA-seq: Library Preparation, QC and Sequencing

November 12, 2024
|
14 min read
Updated:November 13, 2024


In a previous article we discussed preparing a single cell suspension from a tissue sample — from breaking down the tissue to ensuring the cells are alive and healthy.

The next step is library preparation for single cell, library sequencing, and sequencing quality control (QC).

Unlike bulk RNA seq, preparation starts by isolating individual cells.

Current Technologies in scRNA-seq: Methods, Challenges, and Library Preparation

Currently, there are multiple methods to prepare a library for single cell sequencing:


Partition-Based scRNA-seq


In microwell based technology, individual cells are partitioned, barcoded, and lysed before library preparation.

Currently the most used partition-based scRNA-seq method is droplet-based, which uses microfluidics to physically separate the cells and oligo-coated microparticles. Cells are loaded into oil droplets, each encountering a coated microparticle. Cells are lysed, releasing RNA that binds to microparticles. The bound RNA is amplified, and reverse transcribed into cDNA with template switching. Unique indexes are then assigned to each single cell transcriptome, processed together in a single reaction tube, and sequenced.

Plate-Based Combinatorial Barcoding scRNA-seq


Instead of using specialized equipment for cell partitioning, combinatorial barcoding uses fixation and permeabilization to make the cell itself the reaction compartment.

The cells enter an initial 96-well plate, where an in situ reverse transcription reaction adds well-specific barcodes using oligo-dTs and random hexamers. The cells are pooled and split into a second plate 96-well plate, where a second barcode is added to the transcripts, then the pooling and splitting happen a third time. Cells are counted and distributed into sub-libraries, go through lysis, enzymatic fragmentation, end-repair, adapter ligation, and the addition of a fourth barcode via unique dual indexes.

Library Preparation QC

Regardless of the technology used, it’s essential to implement quality control measures, starting with fragment analysis.

After cDNA amplification, a SPRI or a bead cleanup —depending on the technology —is typically performed.

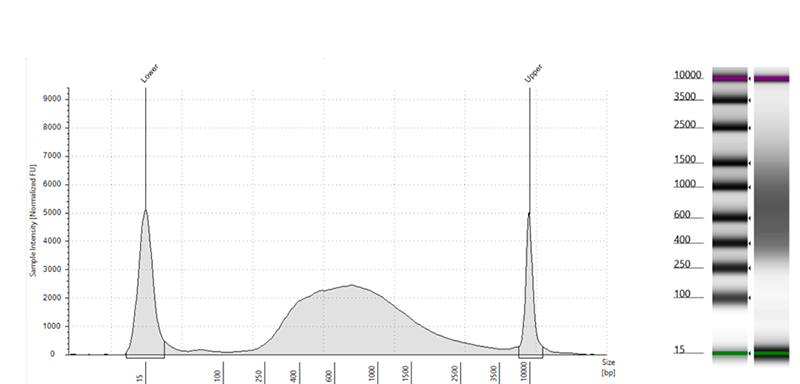
Next, fragment analysis assesses the quality of the cDNA. The electropherogram should show cDNA fragment sizes ranging from approximately 300–400 base pairs to as large as 9,000-10,000 base pairs, typically with a gradual rise (Figure 1). However, depending on the cell type and its underlying biology, users might observe distinct or sharp peaks in the trace. This might represent an abundant cell-type transcript. The ideal trace shows a library distribution between 500 to 800.


Figure 1: Expected post-amplification sublibrary cDNA size distribution using combinatorial barcoding.

The trace should align with the user’s expectations and be consistent with the biology of the sample.

After library indexing and cleanup, a second trace should be evaluated to QC the distribution of the library. In standard NGS workflows, typically the library is around 400 to 500 base pairs, the ideal size for clustering on an Illumina sequencer (Figure 2).


Figure 2: Expected Size Distribution before Illumina Sequencing

Technical Considerations in scRNA-seq Library Preparation

Single cell barcoding is the part of the experimental workflow that prepares the libraries for sequencing. Two technical considerations that depend on the experimental design and the technology of choice need to be mitigated.

Multiplets and How to Avoid Them


One key issue is multiplets, which occur when two or more cells are assigned the same barcode during library preparation, leading to inflated expression values for a single cell. Species mixing experiments are often used to estimate the multiplet rate.

In droplet-based methods, multiplet rates are typically in the low double-digit percentage range, while in combinatorial barcoding methods, they are usually in the low single digits.

Understanding how multiplets arise is important for addressing the issue.

In droplet-based approaches, multiplets happen when two cells share the same droplet.

Although computational methods can remove multiplets by setting thresholds, this often results in discarded sequencing data.

Preventing multiplets requires understanding their causes, such as improper cell counting or excessive clumping.

Cell clumping can cause cells to aggregate in the same droplet or stick together during barcoding.

Best practices to avoid it include proper sample dissociation and using the correct cell filters. If cells are unusually sticky, it may be due to genomic DNA release during preparation, which can be addressed by adding DNase to reduce the stickiness.

Ambient RNA


Ambient RNA is background RNA released by damaged or dying cells. Despite careful handling, some cell attrition is inevitable, resulting in ambient RNA.

In droplet-based methods, it can be incorporated into the emulsion droplets, where it is barcoded along with the cell’s transcriptome, potentially leading to its misattribution to that cell.

In combinatorial barcoding methods, where each cell acts as a reaction vessel, ambient RNA also has the potential to be barcoded, but the wash steps reduce this likelihood. Moreover, ambient RNA would have to follow the same path as a cell to be barcoded in the same way, making this scenario less probable.

Sequencing

Identify the Most Efficient and Informative Number of Reads

When moving on to the sequencing aspect, it’s crucial to fully understand the library structure and communicate the correct information to the sequencing provider.

One key detail to specify is the number of sequencing cycles required. Not allocating enough cycles to the barcodes will impair the distinction between individual cells. Similarly, if there aren’t enough cycles to sequence the cDNA inserts, alignment to the reference genome will be compromised.

The number of reads is another consideration based on experimental needs. Unlike bulk, in scRNA-seq there is not “read per sample”, but “read per cell.” The general recommendation is 20,000 to 50,000 reads per cell, depending on the sample.

Indeed, a very RNA-rich sample may retain 30 to 40% of the genetic information at the recommended read depths and might need to be sequenced deeper. It depends on what depth of sequencing is sufficient to answer the biological question.

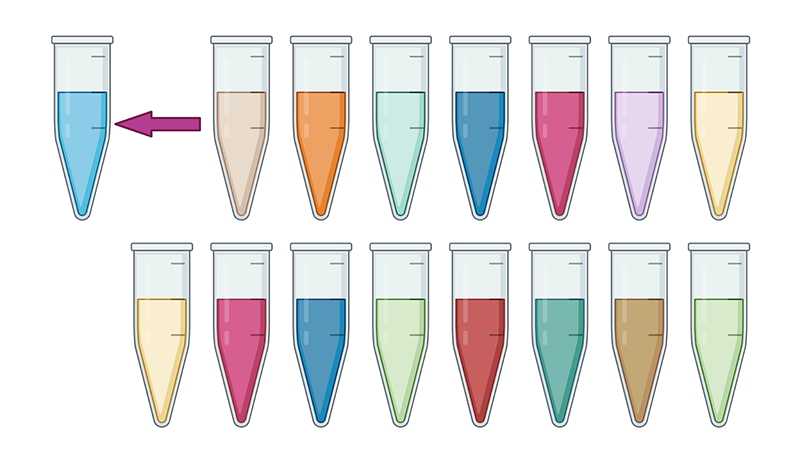
An advantage of combinatorial barcoding methods is to remove the trial and error with a clever solution built into the technology. One or more sublibraries generated at the end of the workflow can be used to optimize a cost-effective sequencing run, helping to determine the saturation level—the point at which gene transcript detection is sufficient to answer the biological questions (Figure 3). Once this optimal depth is identified, it can then be applied to the remaining sublibraries for a more efficient sequencing strategy.

Figure 3: With combinatorial barcoding one sublibrary can be used to dial in the optimal sequencing depth for the sample.

QC for the Sequencing Run

After sample sequencing and before starting data analysis, it is part of the workflow to run quality control tests and generate a summary.

Sequenced libraries are delivered by the sequencing provider as FASTQ files.

FASTQ files are text-based files that store sequencing data, containing both nucleotide base calls and their associated quality scores. These files can also include additional information, such as details about the sequencing instrument, the read’s position in the flow cell, lane information, and flow cell identifiers.

It is important to review the demultiplexed FASTQs. FastQC is a tool that analyzes FASTtQ files from sequencing runs, performing a series of quality control tests and generating a summary HTML report. MultiQC integrates these reports, providing a comprehensive, interactive overview of data quality.

The first parameter to examine in a FastQC report is the per-base sequence quality. This is typically represented as a box-and-whisker plot that shows the quality of the sequence across the read. One common observation is that the first four or five cycles, where cluster calling and phasing occur, tend to have slightly lower quality than subsequent cycles. In short-read sequencing, it’s also normal to see a decline in quality toward the end of the read. This happens because, as reads get longer, the sequencing chemistry degrades, clusters fall out of phase, and the confidence in base calling decreases.

It’s also common for read two to have slightly lower average quality than read one, which is often due to cluster regeneration artifacts.

Sequence diversity can also affect quality, particularly in sequencing-by-synthesis platforms. Overall, the quality scores should fall within the expected range.

Evaluating the Per-Base Sequence Content to Assess Library Structure

Combinatorial Barcoding

One of the critical steps in evaluating a sequencing run is analyzing the per-base sequence content, which provides insight into the structure of the library. A key question to consider is: how should the base composition appear?

In the context of a combinatorial sequencing run, it’s important to remember that read one typically represents the cDNA insert, while read two corresponds to the barcode. In a random library, one would expect high base diversity, with each base (A, C, T, G) being equally represented. This balanced distribution results in parallel lines when visualized on a sequence composition plot.

It’s common to observe some degree of noise at the beginning of the read, often attributed to random hexamer priming bias. This variability is normal and does not negatively impact downstream analysis, so there is no need for concern.

For read two, variations in base diversity are to be expected, as these reflect the inherent structure of the library. In this case, the barcode contributes to good base diversity. However, regions containing linkers may exhibit reduced diversity, which is typical. You should observe alternating sequences—barcode, linker, barcode—confirming that the sequencing process is functioning as expected

An important consideration in sequencing by synthesis runs, such as those performed on Illumina platforms, is that some sequencers may struggle with libraries that lack base diversity. To mitigate this issue, Phi-X can be added or spiked into the run. Phi-X increases base diversity, ensuring that the sequencer performs optimally and that your sequencing quality, including metrics like Q30 scores, remains high.

Other scRNA-seq Technologies

In cases where non-combinatorial barcoding or specialized sequencing techniques are utilized, such as amplicon sequencing, methyl-seq (which converts cytosine to thymine), or tagmentation, there may be shifts in base composition. These variations are expected, given the unique characteristics of the library preparation and sequencing chemistry. Recognizing the structure of the library and familiarity with its expected behavior is essential for accurate interpretation of the data. Ensuring that the results align with these expectations allows researchers to confidently move forward with downstream analysis.

GC Content in Sequencing Analysis

Another important consideration in sequencing evaluation is Guanine-Cytosine (GC) content.

Examining the GC content can help confirm that the sequencing output matches the expected profile, achieved by comparing the theoretical distribution to the actual distribution of the reads. Differences between the two are expected because read one (the insert) and read two (the barcode) represent distinct entities with varying base compositions.

However, sharp peaks or overrepresented sequences in the GC content analysis could indicate potential contamination or biologically relevant sequences. While these occurrences might not always be problematic, it’s a good practice to investigate them further to determine if they align with experimental expectations.

Taking the time to review these patterns ensures a comprehensive understanding of your sequencing run’s performance and helps you identify any irregularities that may require attention.

Secondary Analysis: Barcode Rank Plots in Single Cell Sequencing

After FASTQ files undergo a basic QC check, often referred to as primary analysis, the data are fed into a pipeline for deeper analysis, where the various aspects of the experiment are examined in more detail.

One of the key tools in this process is the barcode rank plot, also known as a knee plot. This is where the principle of “quality in, quality out” becomes most evident, as the efforts made during cell preparation pay dividends in the clarity and reliability of the data.

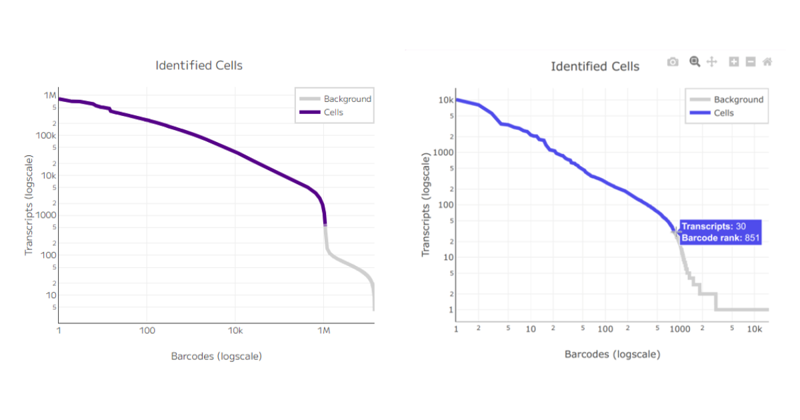
In a barcode rank plot, barcodes are ordered based on the number of associated transcripts, which are plotted along a gradient using log-transformed axes. The inflection point—a key feature of the plot—represents the minimum transcript threshold. Barcodes above this threshold are considered to correspond to individual cells, while those below are interpreted as background or ambient RNA. This inflection point allows us to set a cell cutoff threshold, distinguishing real cells from noise in the data.

A well-formed knee plot is an indication of a successful experiment. The clear inflection point, or “knee,” suggests that the cell preparation and sequencing process went smoothly. On the other hand, if the plot shows a smooth curve without a defined knee, it may indicate problems with the input sample, such as an excess of dead or damaged cells. This is a sign that the sample quality might have been compromised, and further investigation is needed (Figure 4).

Figure 4: A cell cutoff threshold with a distinct inflection point in the curve indicates a successful experiment (panel on the left) whereas a smooth line indicates an excess of dead and damaged cells (panel on the right).

Evaluating Cell Numbers, Gene Counts, and Sequencing Saturation in Single Cell Experiments

One of the first key metrics to consider in single cell sequencing experiments is the total number of cells recovered. This value is typically defined by the barcode rank plot, and it’s essential to compare it against the user’s expectations. For example, what was the target number of cells for sequencing, and how many were actually recovered? Accurate cell counting is crucial.

The next set of quality metrics includes median transcripts, median genes, and reads per cell.

The median transcript count reflects the unique transcripts used to identify gene expression, which in turn correlates with the quality of the cells in the assay.

However, the median gene count is often one of the more critical metrics when evaluating sequencing quality. This value should be considered alongside sequencing saturation—the proportion of the library that has been sequenced to its full depth. If sequencing saturation is low, it might explain a lower gene detection rate, though this could also result from working with a sample type that naturally has fewer transcripts. Setting appropriate expectations for the experiment and confirming whether the data fall within an acceptable range is vital for interpreting the results.

Reaching the targeted reads per cell is another important consideration as it impacts the sequencing saturation.

Sequencing saturation is a valuable measure of how much capacity remains for additional gene detection in a sample.

Depending on the population in focus, different saturation levels may be adequate: if the focus is a rare cell population, then higher saturation may be required to capture less abundant cell types.

However, there should be a balance between the cost of sequencing, the sequencing depth required to answer the question, and the saturation level.

Evaluating Q30 Scores and Transcriptome Map Fraction in Sequencing Quality Control

The final quality control check in sequencing analysis focuses on Q30 scores, which are crucial for evaluating the overall accuracy of your sequencing run. Q30 scores relate to per-base quality scores and indicate the percentage of reads with a Phred score of 30 or higher, meaning a 99.9% base call accuracy.

A Q30 score in the range of 80% or higher is considered excellent, indicating high-quality sequencing. However, if lower Q30 scores are observed, it could suggest problems with the sequencing run that could lead to inaccurate conclusions. A consistently low Q30 score might indicate a failed run, prompting the need for further investigation.

Should that be the case, and if a FastQC report has not yet been generated, it would be advisable to run this analysis on the FASTQ files to identify potential causes for the lower quality, particularly with respect to barcode performance.

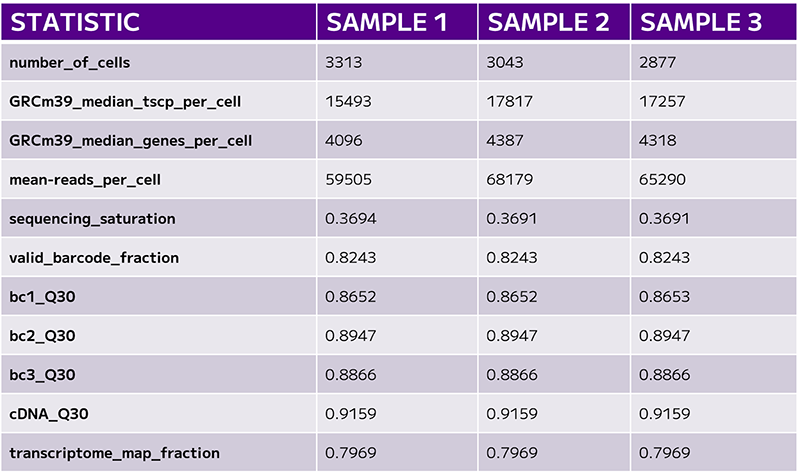
Another critical metric to assess is the transcriptome map fraction, which measures the proportion of reads with valid barcodes that align with annotated genes in your genome of interest. This is an important indicator of how well the sequencing data reflects the actual biological content of the sample (Table 1).

Table 1: The final set of QC evaluates cell numbers, gene counts, and sequencing saturation.
 

The Importance of Tertiary Analysis in Single-Cell Sequencing Workflows

While secondary analysis helps assess the quality of your sequencing data, tertiary data analysis begins to interpret and extract meaningful insights from the results. This stage allows us to ask scientific questions, and dive into functional analysis. Tertiary analysis involves the use of tools like Seurat, Scanpy, or platform-specific methods such as Split-Pipe and its web-based cloud version, Trailmaker.

This phase is the most time-consuming part of the bioinformatics workflow, as it requires iterative analysis, refinement, and ultimately experimental validation. It will require multiple rounds of analysis to hone in on the findings that are most relevant to the study. Though this process demands time and patience, it is also where the true value of your data is realized. We will explore this in more detail in the next article.

Key Takeaways

ScRNA-seq offers a diverse array of library preparation methods, each with unique advantages and challenges.

From partition-based approaches to plate-based combinatorial barcoding, today there are multiple options suiting all experimental needs.

Implementing robust quality control measures throughout library preparation and sequencing is essential to ensure reliable results.

Understanding each method allows researchers to maximize the quality of their data and effectively address complex biological questions. A well-executed sequencing run, guided by careful preparation and QC, lays the foundation for accurate and meaningful secondary and tertiary analyses.

In the next article, we will cover the last, most exciting part of a scRNA-seq experiment: data analysis.

About the Author

Laura Tabellini Pierre

Laura Tabellini Pierre, MSc, is a scientific and technical writer at Parse Biosciences with extensive experience in immunology, encompassing both academic and R&D research.